(mirror) Chevrolet Bolt EV Range at Constant Speeds
Mirrored From: http://roperld.com/science/ChevyBoltRange.htm
(mirror)Chevrolet Bolt EV Range at Constant Speeds
L. David Roper
http://arts.bev.net/RoperLDavid/
18-Feb-2018
Contents
Introduction
- Energy Losses at Constant Speed on a Level Course
- Range at Constant Speed
- Range versus Temperature
- Drag and Rolling/Accessories Forces
- Constant Rolling/Accessories Drag
- Comparison to Tesla Model S (60 kWh)
- Driving up a Long Hill
- Driving over periodic Hills
- Driving around a Circle
- Conclusion
Introduction
The Chevrolet Bolt EV is due on the market at the end of 2016, the first >200-miles range BEV at a moderate price.
The EPA range for the Bolt has been measured at 238 miles (efficiency 119 MPGe). The EPA measurement involves two different driving cycles:
- City Cycle: 255.1 miles, 128 MPGe
- Highway Cycle: 217.4 miles, 110 MPGe
- Combined Cycles: 238 miles, 119 MPGe
It is useful to know the Bolt range for constant speed driving, such as on a non-congested Interstate highway. Such a test has been done for a constant speed of 75 mph, which yielded a range of 190-miles at 72°F air temperature on a level course .
The purpose of this article is to use the 75-mph data to create a range curve for different constant speeds.
Energy Losses at Constant Speed on a Level Course
Components to vehicle drag
- Aerodynamic drag
- Rolling friction and accessories
These two components vary with vehicle speed similar to the following graph for tractor-trailer trucks:
Although this case is for a tractor trailer, similar curves apply for any vehicle.
Aerodynamic air-drag force is calculated by the following equation:
The energy dissipated by the air drag is Ed = Fdd, where d = distance traveled, the range at constant speed if on air drag applies.
The calculation was done in the MKS system and then converted to the British System. The following are conversion constant that were used:
- 1 mph = 0.44704 m/s
- 1 meter = 3.2808 feet
- 1 meter = 6.2137 x 10⁻⁴ miles
- 1 kWh = 3.6 x 10⁵ joules
The density is of the medium in which the vehicle is traveling, the air, which has density of 1.2 kg/m3 at 72°F.
The Bolt battery is 60 kWh, but probably 1.5 kWh is reserved at the top and bottom of the charge; so, it is assumed that only 57 kWh (2.052 x 10⁸ joules) is available to be dissipated.
For the Bolt: c = 0.312 (rather high for a BEV), A = 25.8 ft2 = 2.34 m2.
Using these values, the range due to air drag only yields ~ 253 miles for the range at 75 mph constant speed, much too large. Rolling/accessories dissipative force is needed. Assume that the "rolling friction and accessories" dissipation is linear in the speed, as shown in the graph above. Then the energy required to move the Bolt at constant speed is the sum of the kinetic energy provided at the start and the energy lost to air and road friction::
where d = range, F = Fr + Fd and Fr = av.
The linear coefficient, a, can be determined by the equation
Range at Constant Speed
Then the range (miles) equation for an arbitrary constant speed, v (mph), is
Putting in the values:
The equation is so long because speed in mph has the conversion constant to MKS units meters/second (0.44704) and distance in meters has the conversion constants from meters to miles (6.2137 x 10⁻⁴). (Of course, not that many decimal places are needed.)
The result for v = 75 mph is d = 190.00 miles, as originally assumed.
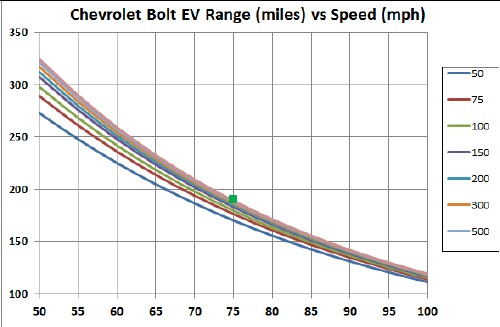
The following graph shows the calculated range for constant speeds between 50 and 100 mph at air temperature 72°F:
The blue line is the EPA range. The green square is the measured range,190 miles, for constant 75-mph.Other losses come in at lower speeds, perhaps at speeds greater than 50 mph. The curve above may bend downward at the lower speeds. It would be helpful to have a constant speed measurement of the range at 50 mph to check this calculation!
Range Versus Temperature
Energy dissipation in a BEV can vary widely with air temperature depending on whether and how battery temperature is regulated. Here is a graph of energy consumed versus temperature for the Nissan LEAF BEV:
The red curve is a 6th-order polynomial fit to the data.About 70°F is an ideal temperature for longest range.
Assuming that the same temperature curve applies to the Bolt, normalize the temperature curve to 1 at 70°F and <1 at higher and lower temperatures to use as a factor to calculate range at constant speed for different temperatures in °F:
The following two graphs show the calculated ranges for different temperatures in °F using the temperature factor in the above graph:
Of course, using the cabin heater during cold weather or the heater during hot weather or the lights at nighttime reduces the range.
The LEAF and Bolt probably use different battery chemistries, so the LEAF temperature-factor curve may not be accurate for the Bolt.
Drag and Rolling/Accessories Forces
This graph shows the drag and linear forces (N=newton unit in MKS system) of the range calculation:
Constant Rolling/Accessories Drag
Suppose the rolling/accessories drag is a constant, Fr = b, instead of linear in v (Fr = av).
The linear coefficient, b, can be determined by the equation
then for the Bolt EV R = b/mg = 163.55/1705 kg/9.8 m/s2 = 0.0097881. This is somewhat larger than for the typical low-rolling-resistance tires (~0 .0075).
Then the range (miles) equation for an arbitrary constant speed, v (mph), is 
Putting in the values:
The result for v = 75 mph is d = 190 miles, as originally assumed.
The following graph shows the calculated range for constant speeds between 50 and 100 mph at air temperature 72°F for both linear and constant rolling/accessories drag:
Perhaps the actual range-vs-speed curve lies between the red and purple curves.This calculation may be more accurate for high speeds than for low speeds.
Compare to Tesla Model S (60 kWh)
Here is a graph of how range versus speed varies for the Tesla Model S:
Note the peaks at about 20 mph.The EPA range for the Tesla Model S (60 kWh) has been measured to be 208 miles (efficiency 95 MPGe). The EPA measurement involves two different driving cycles:
- City Cycle: 208 miles, 94 MPGe
- Highway Cycle: 208.3 miles, 97 MPGe
- Combined Cycles: 208 miles, 95 MPGe
This is a graph of the Tesla Model S (60 kWh) range-vs-speed curve and a 6th-polynomial fit to it:
The lower graph is a normalization of the Tesla range at 75 mph (152 miles) to the Bolt's range at 75 mph (190 miles) (red curve) compared to the range calculated directly above (blue curve). The factor is Bolt-range@75mph/TeslaS60-range@75mph = 190/152 = 1.253669.
The following two graphs show the calculated ranges for different temperatures in °F using the temperature factor given above:
Another, simpler, equation to fit the Tesla-Model-S range vs constant speed is
d = (464.6421+5.228186v+0.0138v2)tanh(v/14.44792) miles (d in miles, v in mph).
The fit was done only to 101 mph.Driving up a Very Long Hill
Consider a hill longer than the Bolt's range at angle Θ:
The angle is
. The minimum angle for 75 mph (Td = 190 miles) is ~1.74°.
Putting the parameter's values in:
This graph shows the range curves for several angles Θ in degrees :
For roads and railroads, the slope of a hill in given in a percentage of the rise/height, or 100tan(Θ) = 100(y/x). For the angles used in the graph, the % slope is given in the second row here:
Θ(deg) | 0 | 0.5 | 1 | 2 | 3 | 4 | 5 | 6 | 7 | 8 | 9 | 10 |
100tan(Θ) | 0 | 0.9 | 1.7 | 3.5 | 5 | 7 | 9 | 11 | 12 | 14 | 16 | 18 |
For a perspective, the steepest railroad, not on a cable, is in Lisbon, Portugal, whose slope is 13.5%.
Driving down a Very Long Hill
Consider a hill longer than the Bolt's range at angle Θ:
The angle is
. The minimum angle for 75 mph (Td = 190 miles) is ~1.74°.
Putting the parameter's values in:
The denominator will equal zero for some minimum angle vs speed and for some maximum speed vs angle, whidh will give an infinite range in both cases:
Driving over Periodic Hills
Consider driving at constant speed over a series of identical hills defined by
The number, n, of hills within the range:
.
Assume that 30% of the energy going up a hill is recovered in battery energy (regeneration) going down a hill. Then the energy required to traverse n hills is:
.
Then the energy required to drive the Bolt's range is
.
Putting in the values for the Bolt for sinusoidal hills 100' wide and five different heights (5', 10', 20', 30', 40', and 50') and one curve for hills 500' wide:
Note that wider hill are closer to the no-hills curve and higher hills have shorter range.
The number of sinusoidal hills in a range d is n = d/(2πx0) = d(miles)x2580(ft/mile)/[2πx0(ft)]:
0',100' | 5',100' | 10',100' | 20',100' | 30',100' | 40',100' | 50',100' | 5',500' |
75410 | 62113 | 52803 | 40625 | 33011 | 27801 | 24011 | 14463 |
Driving Around a Circle
Consider driving at constant speed around a cicle of radius r. The rolling resistance will be larger than the case for straight driving because the fron steering wheels are turned at an angle to the direction of motion in order to stay on the circle. A complicated equation relates the angle of the front wheels to other car parameters:
where s = wheel base (8.53 ft for Bollt), n = steering ratio (16) and r = radius of curvature.
Assume that the constant rolling resistance calculated above (163.55 joules) applies.
The equation is
where the circle radius, r, is in ft and the speed, v, is in mph.
This graph shows the ranges for different circle radii in feet:
Note that the bottom starts at 100 miles instead of 0 in order to separate the curves for the different radii.Conclusion
This calculation does not account for the energy dissipated in the initial acceleration to constant speed, some of which is regenerated when slowing down at the end of the range. Regeneration is typically no larger than 30% of the dissipated energy due to accelerating or climbing hills.
Of course, a realistic drive is never done at constant speed; there will always some elevation changes and occasions when slowing down and then speeding up occurs. So, the curve given here should be considered as an upper limit to the range at a given nearly constant speed.
It would be helpful to have a constant speed measurement of the range at 50 mph to check this calculation!


Comments
Post a Comment